Case Study · Product Design · Consumer Web & Mobile
Compare Anything: How a Comparison Table Survived a Pivot
A comparison feature that started as a table under an app listing became AppGrooves' stickiest page,
then carried the company's pivot from app discovery to deals.
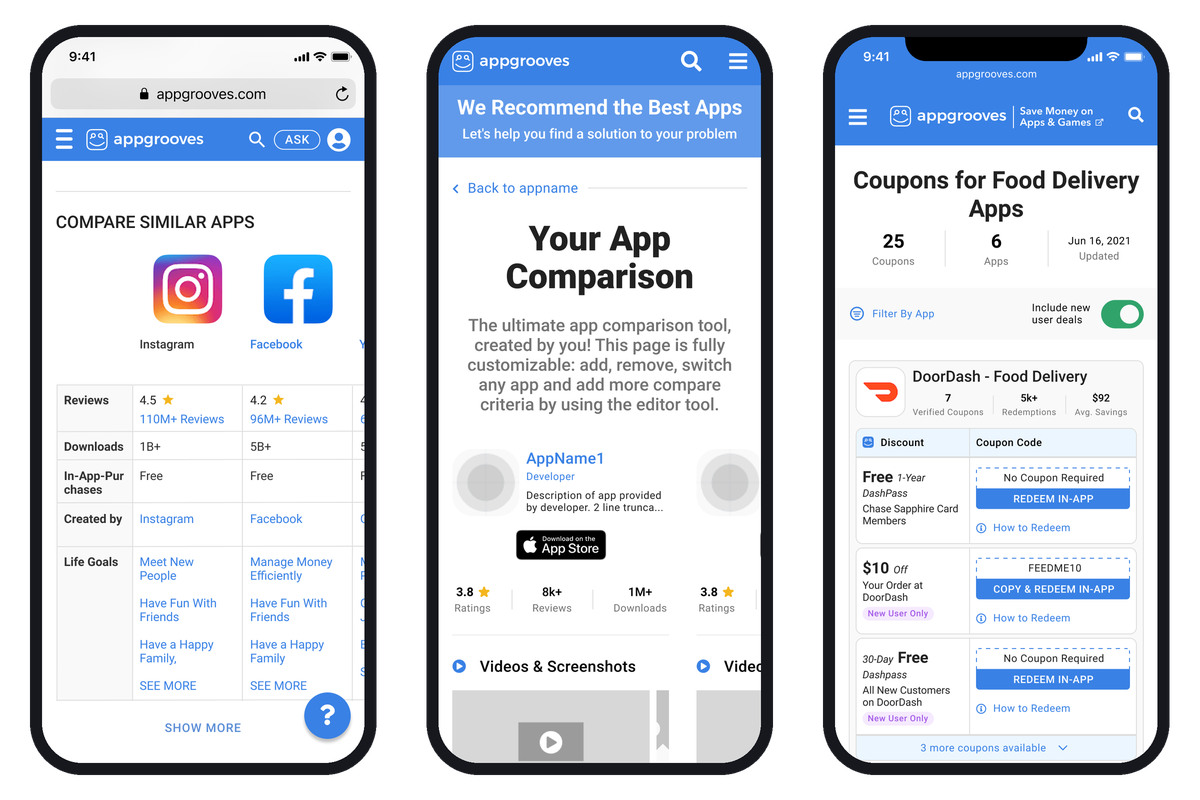
Three phases of one tool: the in-page table (2019), the customizable 4.0 page (2020), and Deal Comparison (2021).
Overview
AppGrooves was an app discovery site with about a million monthly active users, most of them arriving from
Google and leaving the same way. Over two years I led the design of its comparison tool through three lives:
a table inside the app page, a dedicated page users built themselves, and, after the company changed what it
sold, a deal comparison page that ran on paid traffic for 17 iterations.
Background
The idea started with the CEO. He had asked 15 people why they searched Google for an app they already knew
by name, and "comparison among peers" was one of the answers. He sketched an Amazon-style table. I led the
design from there: the first version shipped inside my App Page v3 in December 2019, low on a long page, with
the criteria fixed in a left column and similar apps across the top.
Led the design of every comparison surface from the first table through Deal Comparison v17, directing a UI designer
and running the user tests and weekly KPI reviews that shaped each version.
App Discovery
Deals
The same comparison pattern served app discovery in 2020 and deal shopping in 2021. The page design was the
one asset that transferred across the pivot.
Before 4.0
1.99%
→
After 4.0
8.56%
Problem & Opportunity
Users loved the table and couldn't use it on a phone. In the first rounds of usability testing after launch,
"app comparison" was the most-mentioned like on the page and the same testers said it was "tough to compare"
on mobile and "difficult to see all together." Two more things were true:
- The table sat low on a long page, after reviews, developer notes, and release notes
- Only about half the people who picked apps to compare ever pressed Compare
- On a phone the fixed left column left room for two apps, and the rest scrolled off the screen
- Comparison "vs peers" was one of the two clearest things users wanted from the site, per the company's own analysis
The opportunity was to give the comparison its own page, let users choose the apps and the criteria, and make it
work in a viewport the width of a phone.
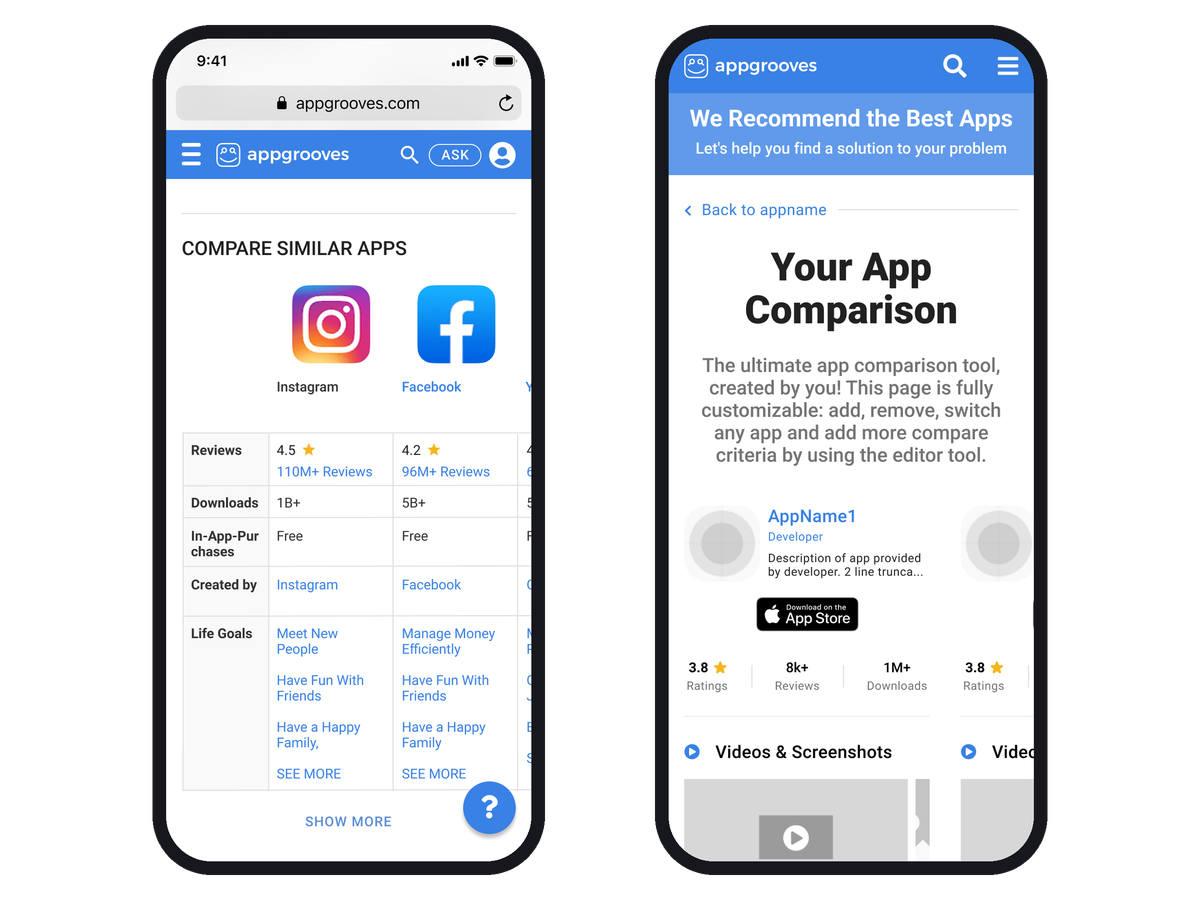
Before: the in-page table on a phone, third app already off screen. After: the 4.0 page, built for the phone first.
Shipped Outcomes
Every release had an old-versus-new week in the KPI review, so this is one of the few projects where the design
changes carry their own numbers. Not all of them went the way we planned, and the page says so.
March 2020: the table came out of the app page and became a dedicated comparison page where users picked
their own apps. The note in the next all-hands deck: "Very very sticky page. Like a rabbit hole." About 40% of
the actions on the page were starting another comparison.
May 2020: a sticky header with save and share, saved comparisons in the user profile, and the two-click
pick-then-press-Compare pattern cut to one click after the data showed half of users stalling at the button.
September 2020: horizontal scroll across up to ten apps, fully customizable criteria, add your own app at
the top. Click-through to the stores went from 1.99% to 8.56%, and over the release and marketing push actions
taken rose 255%. Time on page fell 10%, which we had set as the goal. More on that below.
2021: after the pivot to deals, the same page became a coupon comparison running on paid traffic, 17
versions between June and November, one a week once the paid campaigns started. The first table version converted 46.7% of visitors to a redeem click; the listing
and card layouts in v2 and v3 did 2.5% to 4.4%. By v6 we were back to tables.
By v8, with copy-the-code and open-the-app collapsed into one "Copy & Redeem In App" button, the cost of a
redeem click was $0.86 against $3.21 on v1; later versions reached 62% click-through (v14) and $0.48 per redeem click (v15). A separate push on
signup, told on its own page, took new-visitor signup from 0.46% to the 2% goal.
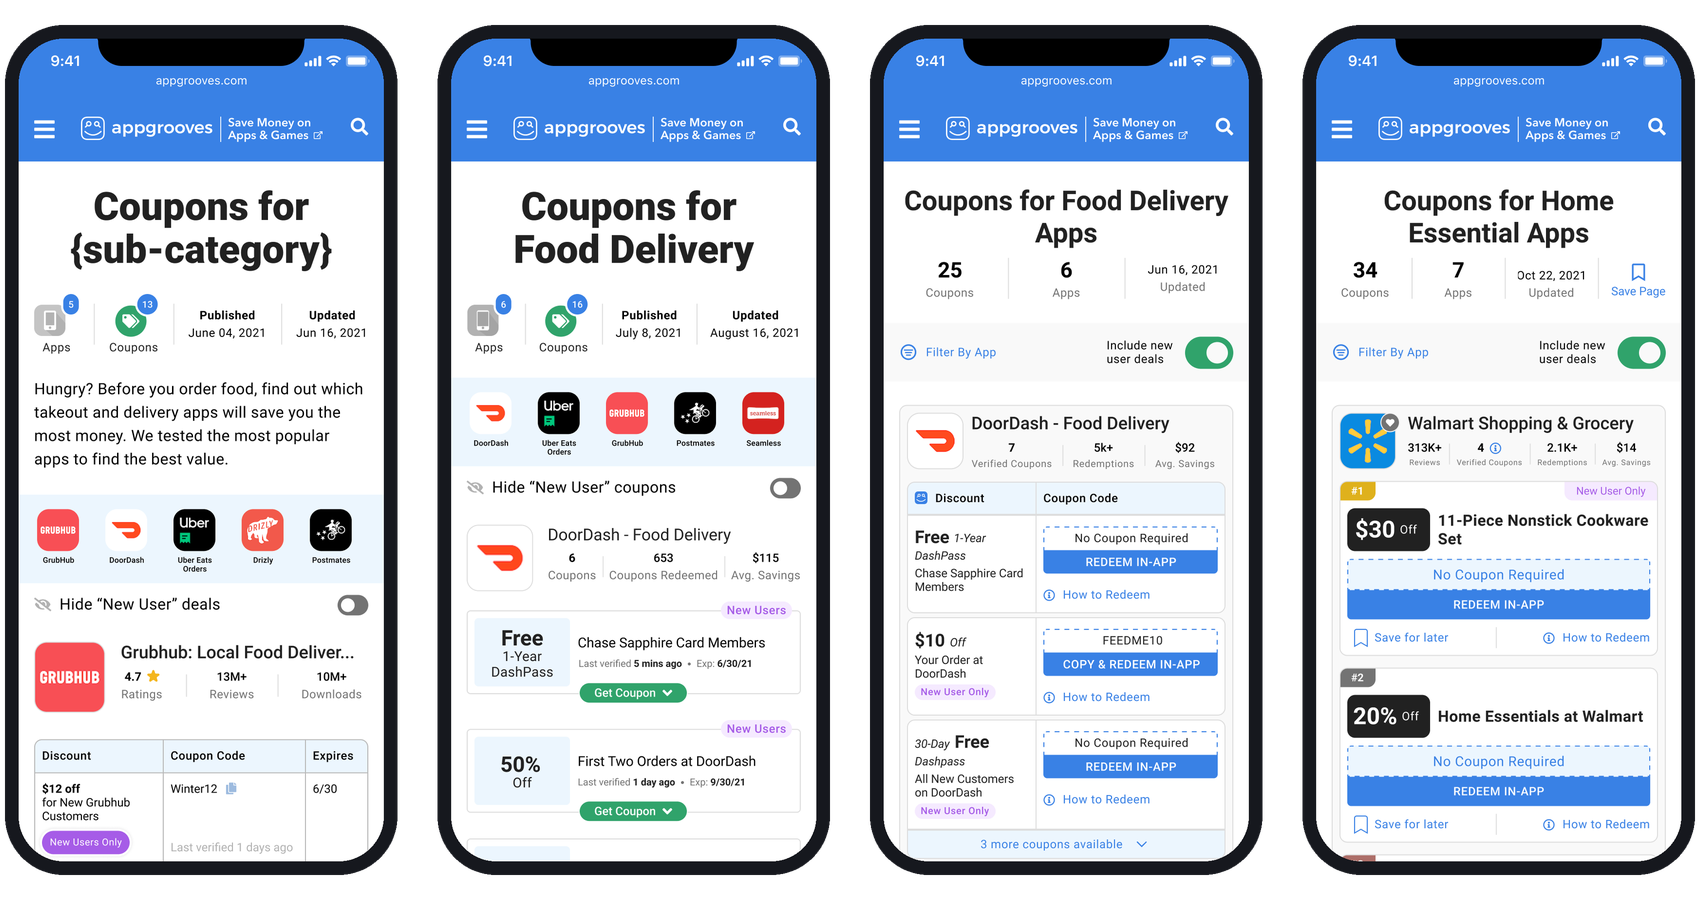
Deal Comparison, left to right: v1 table, v3 cards, v8 one-click redeem, v15 card. Tables won on click-through; one click won on cost.
Conclusion
The lesson I carry from this one is about the goal, not the layout. We set 4.0's targets as time on page and
content per session, and both fell while click-through to the store quadrupled. A comparison tool that works
gets people out faster. I'd set the action as the goal today and treat time as a diagnostic.
The other lesson is that a good pattern outlives the business it was built for. When AppGrooves stopped being an
app discovery site and became a deals site, the comparison page was the thing that carried over. Build the pattern,
not the page.